OpenTelemetry: Where the SQL Is Better Than the Original

This blog post was originally published at TFiR on May 2, 2022.
OpenTelemetry is a familiar term to those who work in the cloud-native landscape by now. Two years after the first beta was released it still maintains an incredibly active and large community, only coming second to Kubernetes when compared to other Cloud Native Computing Foundation (CNCF) projects.
For those who aren’t so familiar, OpenTelemetry was born out of the need to provide a unified front for instrumenting code and collecting observability data—a framework that can be used to handle metrics, logs, and traces in a consistent manner, while still retaining enough flexibility to model and interact with other popular approaches (such as Prometheus and StatsD).
This article explores how OpenTelemetry differs from previous observability tools and how that point of difference opens up the potential for bringing back an old friend as the query language across all telemetry data.
Observability—Then and Now
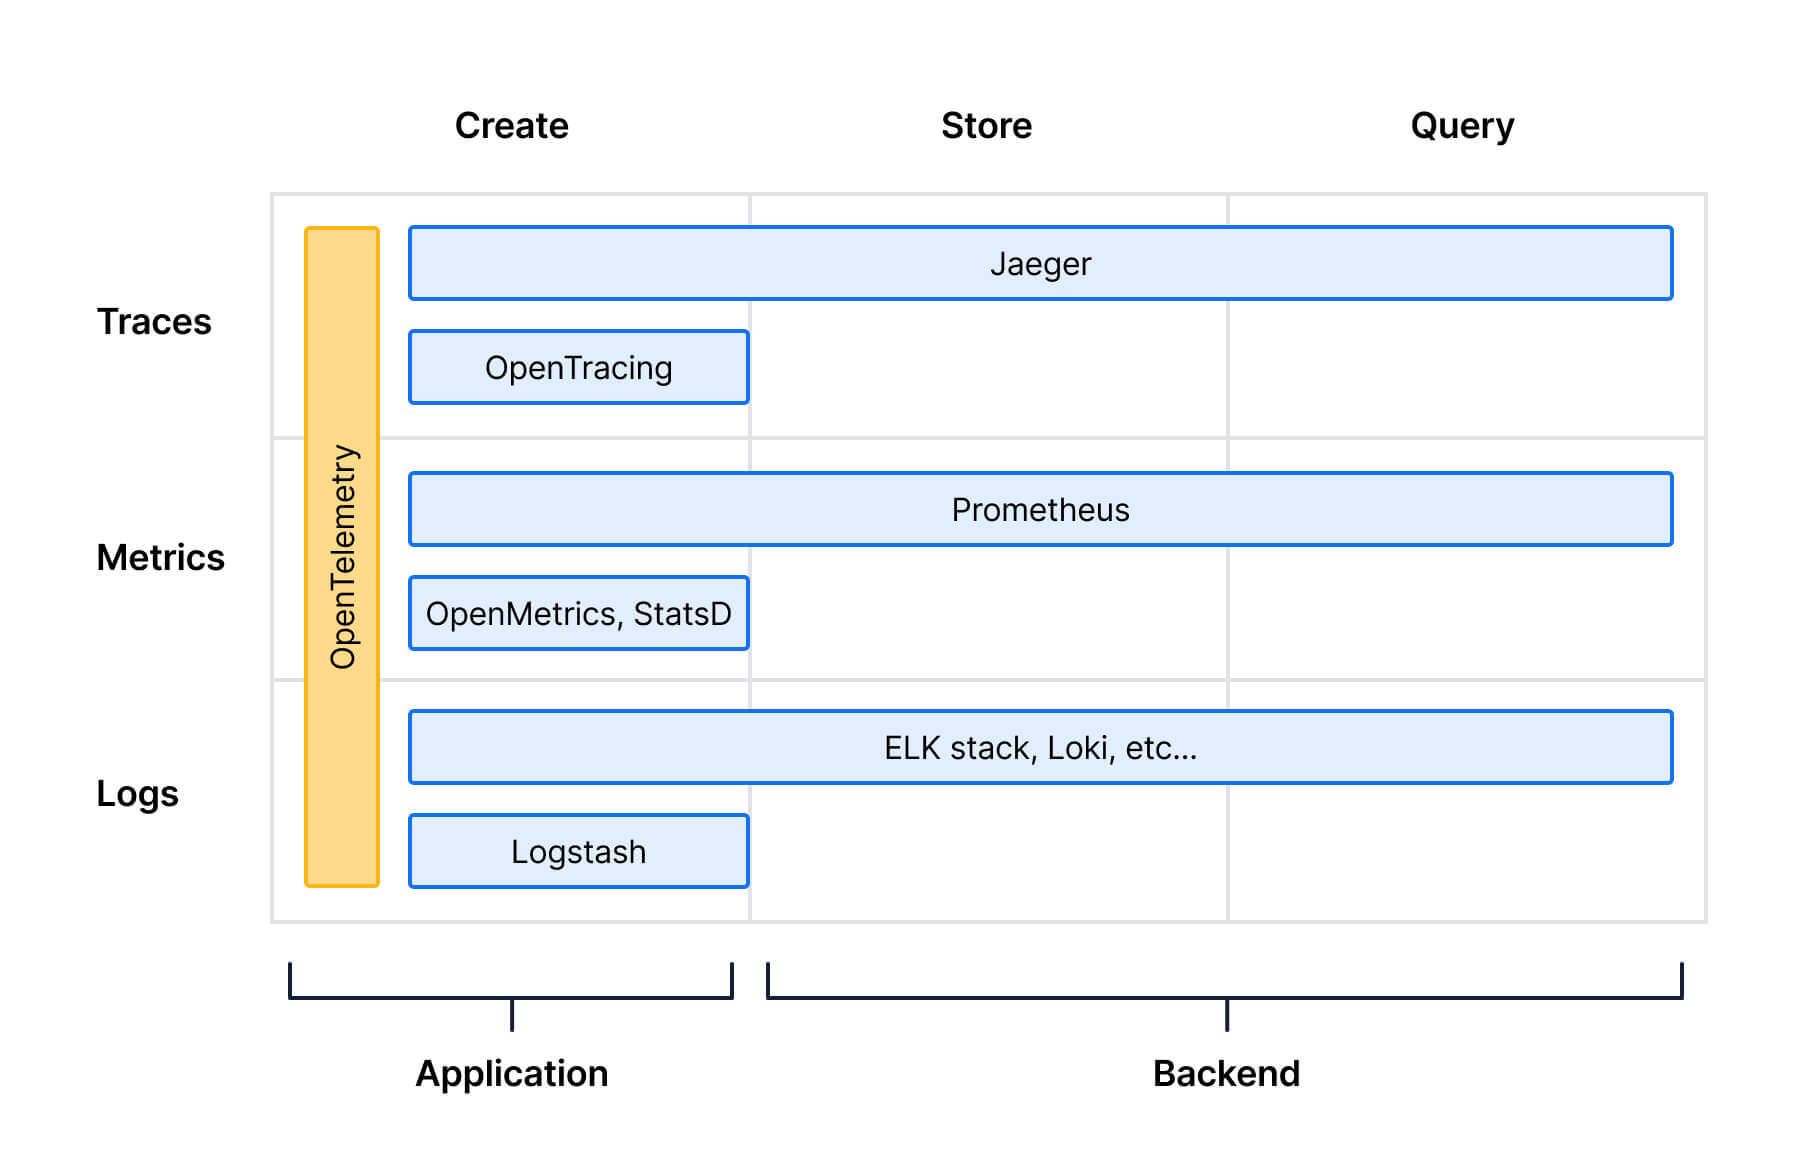
At a high level, the primary difference between OpenTelemetry and the previous generation of open-source observability tooling is one of scope. OpenTelemetry doesn’t focus on one particular signal type, and it doesn’t offer any storage or query capabilities. Instead, it spans the entire area that an application needing instrumentation cares about—the creation and transmission of signals. The benefit of this change in approach is that OpenTelemetry can offer developers a complete experience: one API and one SDK per language, which offers common concepts across metrics, logs, and traces. When developers need to instrument an app, they only need to use OpenTelemetry.

On top of that promise, OpenTelemetry can take streams of signals and transform them, enrich them, aggregate them or route them, interfacing with any backend which implements the OpenTelemetry specification. This opens up a host of new deployment possibilities—a pluggable storage provider per signal (Prometheus, Jaeger, and Loki, maybe), a unified storage provider for all of them, two subsets of metrics to two different backends, or everything being sent out of a Kubernetes cluster to an external endpoint.
Personally, the appeal of OpenTelemetry is very real to me—gathering telemetry data from a Kubernetes cluster using a single interface feels much more natural than maintaining multiple signal flows and potentially operators, and custom resource definitions (CRDs). When I think back to the pain points of getting signals out of applications and into dashboards, one of my main issues was consistently around the fractured landscape of creating, discovering, and consuming telemetry data.
OpenTelemetry and the Query Babel Tower
When discussing OpenTelemetry, the question of querying signals soon comes up. It’s amazing we now have the ability to provide applications with a single interface for instrumentation, but what about when the time comes to use that information?
If we store our data in multiple silos with separate query languages, all the value we gained from shared context, linking, and common attributes is lost. Because these languages have been developed (and are still being developed) for a single signal, they reinforce the silo approach. PromQL can query metrics, but it can’t reach out to logging or tracing data. It becomes clear that a solution to this problem is needed to allow the promise of OpenTelemetry to be realized from a consumption perspective.
As it stands today, open-source solutions to this problem have mostly been offered via a user interface. For example, Grafana can allow you to click between traces and metrics that have been manually linked and correlate via time—but this soon starts to feel a bit limited.
A New Promise
OpenTelemetry promises tagged attributes that could be used to join instrumentation and rich linkages between all signals. So what is the query equivalent of what OpenTelemetry promises? A unified language that can take inputs from systems that provide storage for OpenTelemetry data and allow rich joins between different signal types.
This language would need to be multi-purpose, as it needs to be able to express common queries for metrics, traces, and logs. Ideally, it could also express one type of signal as another when required—the rate of entries showing up in a log stream which have a type of ERROR or a trace based on the time between metric increments.
So, what would this language look like? It needs to be a well-structured query language that can support multiple different types of signal data; it needs to be able to express domain-specific functionality for each signal; it really needs to support complex and straightforward joins between data, and it needs to return data which the visualization layer can present. Other tools also need to support it, too. And hopefully, not just observability tools—integration with programming languages and business intelligence solutions would be perfect.
Designing such a language is not easy. While the simplicity of PromQL is great for most metric use cases, adding on trace and log features would almost certainly make that experience worse. Having three languages that were similar (one for each signal) and could be linked together by time and attributes at query time is a possibility, but while PromQL is a de facto standard, it seems unlikely that LogQL (Grafana Loki’s PromQL-inspired query language for logs) will show up in other products. And, at the time of writing, traces don’t have a common language. Sure we could develop those three interfacing languages, but do we need to?
Why SQL?
Before working with observability data, I was in the Open Source database world. I think we can learn something from databases here by adopting the lingua franca of data analytics: SQL. Somehow, it has been pushed to the bottom of our programming languages kit but is coming back strong due to the increasing importance of data for decision-making.
SQL is a truly a language that has stood the test of time:
- It’s a well-defined standard built for modeling relationships and then analyzing data.
- It allows easy joins between relations and is used in many, many data products.
- It is supported in all major programming languages, and if tooling supports external query languages, it’s a good bet it will support SQL as one of them.
- And finally, developers understand SQL. While it can be a bit more verbose than something like PromQL, it won’t need any language updates to support traces and metrics in addition to logs—it just needs a schema defined that models those relationships.
Despite all this, SQL is a language choice that often raises eyebrows. It’s not typically a language favored by Cloud technologies and DevOps, and with the rise in the use of object-relational mapping libraries (ORMs), which abstract SQL away from developers, it’s often ignored. But, if you need to analyze different sets of data that have something in common—so they can be joined, correlated, and compared together—you use SQL.
If before we dealt with metrics, logs, and traces in different (and usually intentionally simple) systems with no commonalities, today’s systems are becoming progressively more complex and require correlation. SQL is a perfect choice for this; in fact, this is what SQL was designed to do. It even lets us be sure that we can correlate data from outside of our Observability domain with our telemetry—all of a sudden, we would have the ability to pull in reference data and enrich our signals past the labels we attach at creation time.
At Timescale, we are convinced that a single, consistent query layer is the correct approach—and are investing in developing Promscale, a scalable backend to store all signal data which supports SQL as its native language. Whatever the solution is, we are looking forward to being able to query seamlessly across all our telemetry data, unlocking the full potential of OpenTelemetry.


